A couple of interesting things happen when you start paying special attention to website performance and page load speed. One of the more interesting realisations is that caching isn’t always the band-aid you think it is. Here’s why.

In one of my earlier posts I briefly describe the process I went through building this blog framework and all the performance testing I threw at it during the different phases of development.
To my surprise, the results I were getting once the site had gone live were quite different than that when I was doing testing on a production-identical server before launch.
This difference boggled my mind. It was the exact same code, same domain, even the same server. What could possibly be slowing it down? Then it struck me, during development I had Cloudflare turned off.
With the site now up and facing the world, I had Cloudflare lend a hand. I never even considered that this would slow down the website, usually caching is recommended to speed up websites. Bizarre.
Now before I go further it’s important to note that there are very many advantages to using caching and services such as Cloudflare. Lower hosting bills, DDOS protection, minification, superior DNS, and generally a sense of “everything is just better”. Which is why I still use Cloudflare, go ahead and check the response headers if you don’t believe me.
I wanted to do an investigation on just exactly how much time I’m loosing in external overhead. Since my website is hosted in Johannesburg South Africa I also had a suspicion this would affect the numbers based on where the traffic was originating from.
Would direct traffic from halfway across the globe be served faster than via a dedicated caching service much closer?
“If you ain’t first you’re last” - Ricky Bobby.
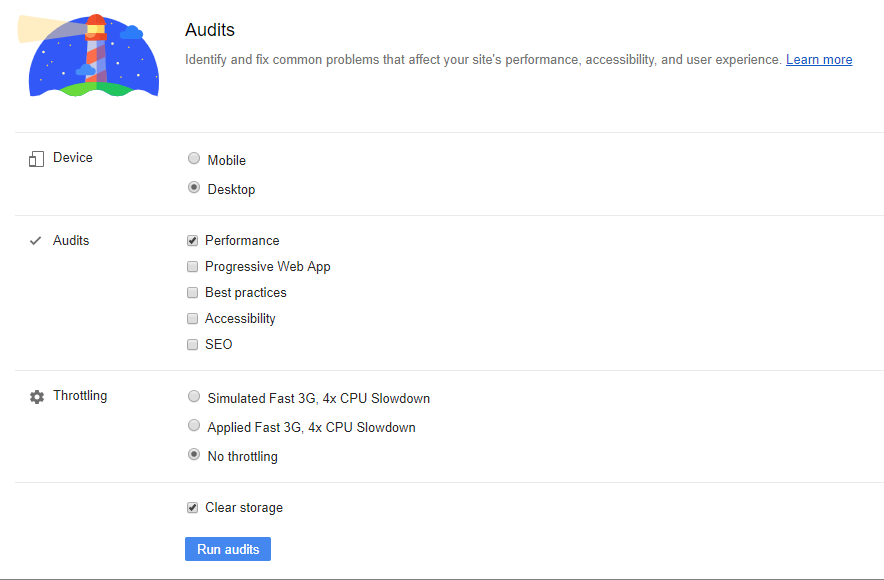
With the last of the Google Cloud Platform (GCP) credits I had laying around I spun up eight identical virtual machines all around the globe and ran some tests using the built-in Google Chrome Lighthouse performance tool.
Each VM was setup with:
- Windows Server 2019 Datacenter x64
- 1vCPU, 3.75GB RAM, 50GB HDD
- Google Chrome 72.0.3626.96 (Latest at time of writing)
On to the results.
Results
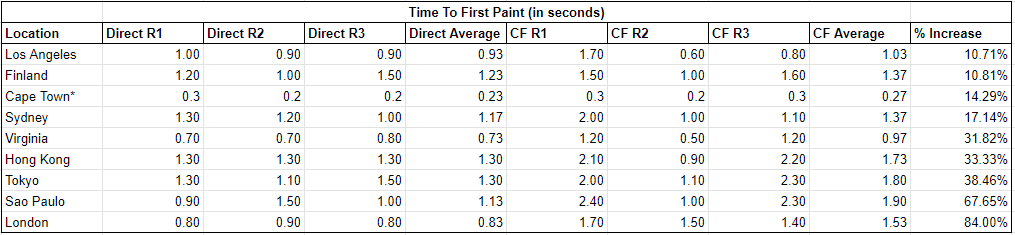
I performed three direct traffic performance tests and then three performance tests via Cloudflare from each origin server location.
It took 25-30 seconds to perform and record each test result. Afterwards I calculated the averages for each type of test and the percentage difference.
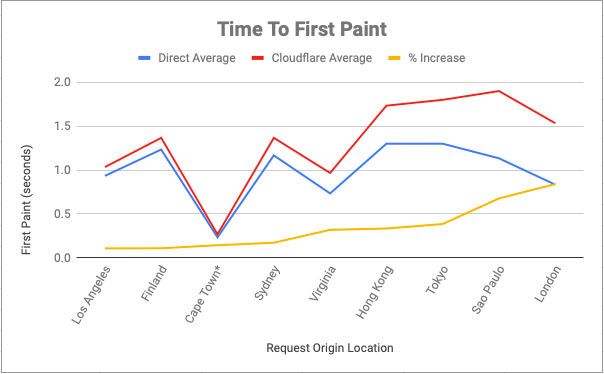
The results are interesting to me for a couple of reasons:
- There is a wide range of percentage difference between the tested locations. This could be due to route congestion and/or the quality of the “normal” internet routes to/from South Africa.
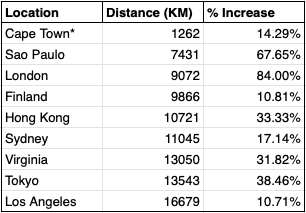
- The smallest change was measured on the furthest route from Los Angeles at only a 10.7% increase across 16,679 KM (10,363 Miles) straight line.
- Origins close to each other have very different results. Finland is the second fastest and its closest tested neighbour London was the slowest of all. London is geographically closer to South Africa and that reflects in the average response times between the two; perhaps Cloudflare London is doing a lot of routing.
This next point is so important I don’t want to bury it in the caveats below. These results (and especially relative increase percentages) are based on my highly optimised website first paint times and only applicable to hosting in South Africa as that is where the traffic needed to go.
If your website is hosted anywhere else you will see very different results.
If your website is even slightly slower the Cloudflare overhead will be much less relative to the raw first paint number.
My raw overhead measured from 0.03 seconds (Cape Town) to 0.77 seconds (Sao Paulo). 0.77 Seconds could be less than the time it takes to load jQuery on a slow 3G mobile connection. Given everything you get even on the free Cloudflare plan that’s time I’ll gladly pay.
Caveats
Here we go with the laundry list of caveats.
Time To First Paint isn’t the ideal metric you should focus on for CDN/Cache effectiveness. Total load time or time to interactive are generally more applicable, unless a site does something stupid like depending on large render-blocking resources (many do actually).
These tests are for single client request page load times, in reality, your website should have more simultaneous traffic which changes the equation in favour of caching and CDN’s even more. Warm caches make for warm hearts.
Chrome’s Lighthouse results are woefully inconsistent, even when run against a server running on a private network milliseconds away. There could be many factors that influence it, but I’ve got a sneaky suspicion that Lighthouse isn’t really meant for these kinds of tests. I’m sure better-suited performance analysis tools exist, I just haven’t bothered using them.
I’ve also stuck to using the “desktop” tests from Lighthouse as the “mobile” tests simulate mobile hardware which leaves even more room for error. Ideally, I would have liked to test for mobile devices as a large part of my audience are generally on mobile.
The Cape Town based test is the only real-world applicable scenario. For all the other locations I’m pretty sure the GCP Datacenter network exit point and Cloudflare POP for the region are extremely close to each other. The few times I tested this the ping from the GCP server to the Cloudflare edge was <1ms. Most of us don’t share a local network with our nearest Cloudflare node so there will be an extra delay before we enter onto the Cloudflare network.
Cloudflare has a premium feature called Argo which smartly routes traffic using the fastest available route instead of whichever is available. I’m certain this would reduce the overhead we see when using their service and bring it closer in line with direct hits.
It might also be useful to know I performed these tests on a Saturday when internet traffic should be very different than during normal office hours.
Thanks for stopping by.